A transparent statistical edge
for football corner betting.
No tipster magic. No black box. Every prediction shows the projection number, the inputs, the chance of winning and our fair odds, so you can audit every pick before placing a bet.
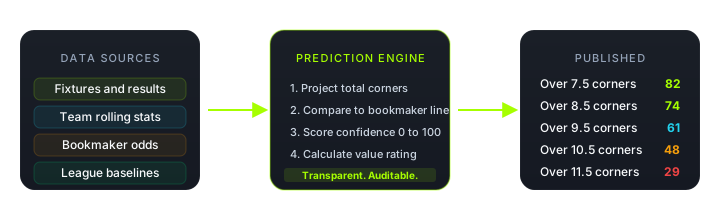
The four step process
Every football corner prediction at corneredge.bet goes through the same four steps. Same data, same math, same logic on every pick. You can rebuild the projection on the back of a napkin and arrive at the same number we publish.
Pull rolling team stats
For both teams we pull rolling averages over the last ten matches. Corners for, corners against, home and away split, first half corners, recent form. League baseline pulled in parallel.
Project total corners
Each side gets a projected corner total. Home corners use the home team home average and the away team away concede rate. Same idea for the away side. Two projections are summed.
Work out the chance
Each pick gets a chance of winning, taken from thousands of settled picks: how often picks with the same line, the same gap between projection and line, and the same amount of team data really won. Low samples lower the chance, they are not hidden.
Check the price
Our fair odds are 1 divided by the chance. We compare them with live bookmaker prices and show how far the best price sits above or below them, in plain words, without calling any bet value.
What feeds the model
| Input | Source | Refresh |
|---|---|---|
| Fixtures and statuses Kickoff, league, venue, status | Football data provider | Every 6 hours |
| Team rolling stats Corner averages, goal trends, form | Match level stats | Every 12 hours |
| League baselines Season averages per market | Aggregated from team data | Daily |
| Bookmaker odds Best available line per market | Multi sportsbook feed | Every 4 hours |
| Predictions Output of the model | Generated internally | Every hour and after any data update |
The corner projection formula
The math is intentionally simple. A simple model that we can fully audit beats a complex model that nobody can interrogate. Here is the full projection.
projected_home_corners = avg( home_team_corners_for_home, away_team_corners_against_away )
projected_away_corners = avg( away_team_corners_for_away, home_team_corners_against_home )
projected_total        = projected_home_corners + projected_away_corners
projected_total        = ( projected_total × 0.85 ) + ( league_average × 0.15 )
The final line is a regression to the mean. We pull the projection 15% toward the league baseline so a single hot streak from a team does not blow up the number on a single noisy sample.
Worked example: Arsenal vs Chelsea, Premier League
| Arsenal home corners for, last ten home matches | 7.2 |
| Chelsea away corners conceded, last ten away matches | 5.8 |
| Projected Arsenal corners | ( 7.2 + 5.8 ) ÷ 2 = 6.5 |
| Chelsea away corners for | 4.9 |
| Arsenal home corners conceded | 3.6 |
| Projected Chelsea corners | ( 4.9 + 3.6 ) ÷ 2 = 4.25 |
| Sum of both sides | 10.75 |
| Premier League corner baseline | 10.0 |
| Final projection 85% model plus 15% baseline | ( 10.75 × 0.85 ) + ( 10.0 × 0.15 ) = 10.64 |
The published projection for this match is 10.64 total corners. Any market line under 10.5 lands in the over zone. Any line above 11 lands under. The further the line sits below the projection, the higher the chance of the over climbs.
What the chance means
The chance is the share of picks like this one that really won. A 70% chance means picks shown at 70% have won about 7 times in 10. Every chance sits between 5% and 95%.
It is worked out from every settled pick: we compare what the model said before kickoff with the final result. For corners, the chance comes from the line, how far the projection sits above or below it, and how much data both teams have. For goals and both teams to score, the model probability is rescaled the same way. The fit is checked every week against the last three weeks of results, and it is only replaced when the new one is at least as accurate.
Picks like this have won 8 times in 10 or more. Rare.
Wins about 7 times in 10. The usual tier for the safest line on a match.
Wins more often than not, with a real chance of losing. A common tier for the recommended bet. Better as a single than in a long accumulator.
Wins a little more often than it loses. Shown as "Worth a look" on a match page, never as a recommended bet. It still links to the best price, and our recommended bet record does not count it.
Loses more often than it wins. Never the recommended pick. When the over is under 50%, the match card shows the under as "Our read", with the best under price.
How the recommended bet is chosen
On a match page, the recommended bet is a corners line with a chance of at least 60%, where the projection sits above the line. Among those lines, we take the one with the best chance that a sportsbook prices at 1.50 or more. When no such line pays 1.50, we take the best paying line that still has 60% or more. When no priced line reaches 60%, the card shows the safest priced line: as "Worth a look" when its chance is 50 to 59%, or the under as "Our read" when the over is under 50%. Every card with a sportsbook price links to the best price, and the label tells you how strong the pick is. Our track record counts the recommended bets only.
The safest line is usually over 7.5 corners. It wins more often, but its price is often 1.20 or less, and at prices that short the sportsbook margin takes a bigger share of the return. On more than 8,500 settled matches, checked at the prices our sportsbooks showed before kickoff, the recommended bet chosen this way gave back more of the stake than the safest line did. Neither made a profit over that time. The safest line still shows on the match card, so you can pick either one.
How picks are chosen and ranked
Which picks appear in the tables, and in which order they are chosen for the accumulators, comes from a strength score built from the projection and the data behind it. The table shows how it is made. The percent on the page is the chance, not this score.
| Component | Effect on the strength score |
|---|---|
| Base | 50 |
| Edge against the line Projected total minus the bookmaker line | +6 per corner of edge |
| Healthy sample Both teams have 5 or more rolling matches | +4 |
| Established sample Both teams have 10 or more rolling matches | +4 |
| Low sample penalty Either team has fewer than 3 matches | −10 |
| Score range cap | 0 to 95 |
Fair odds and the best price
A high chance is not automatically a good bet. The price has to pay more than the chance is worth for the bet to make money over many tries. Every pick page shows our fair odds next to the best price, so you can see both.
fair_odds = 1 / chanceFor the Arsenal vs Chelsea match in the example above, suppose Over 9.5 corners has a 68% chance. Fair odds are 1 ÷ 0.68 = 1.47. A sportsbook price below 1.47 pays less than the chance is worth.
Most prices sit a little below our fair odds, because every price carries the sportsbook margin. We used to add a verdict on each price. On settled recommended bets, the ones whose price looked above our fair odds won 55 to 61% of the time, where we had shown 65 to 68%. A price that looks better than our fair odds usually means the sportsbooks read the match differently, and so far they have more often been right. So the pick page gives no verdict on the price, and never calls a bet value.
What you will not find here
No guaranteed winners
Betting is probabilistic. Anyone advertising guaranteed wins is selling a narrative, not data.
No fake certainty
No chance is shown above 95%. A 99% call on a single match would be dishonest.
No paid VIP tier
Every prediction we make is on the public site. There is no hidden Telegram group for paying members.
No black box
The model is documented on this page. The inputs are listed above. You can rebuild any pick from scratch.
Open by design
- Every prediction page shows the projection number, the inputs and the reasoning.
- The chance and our fair odds are published per pick, next to the best price.
- Sample sizes are labelled. Low sample picks carry a penalty, not a polish.
- Every page carries the last updated timestamp.
- Sportsbook links are clearly disclosed as affiliate links.
Editor notes
How CornerEdge generates predictions
Our prediction model combines team-level rolling averages, recent form weighting, league baseline normalization, and odds-implied probability comparison. All predictions are statistical projections, not guarantees.
See the methodology in action
Open any prediction page. The number you see comes from this process. The reasoning panel on each pick spells out which inputs landed where.